What is data visualization ?
Data visualization is a branch of data science, which is the extraction of knowledge from data. In fact, we have been doing data visualization since we were little without even knowing it. The graphical representation of mathematical functions that we did at school was already data visualization, because it consisted in associating a graphical representation to a set of data to make them more readable. Data visualization is therefore the science of representing a large amount of data in graphic form to make it more intelligible. Extrapolating the reasoning, the brain can be considered as the first expert in data visualization, because it associates a set of physical data, in this case light waves, in a graphic representation of shapes, colors, gradations, to constitute the vision.
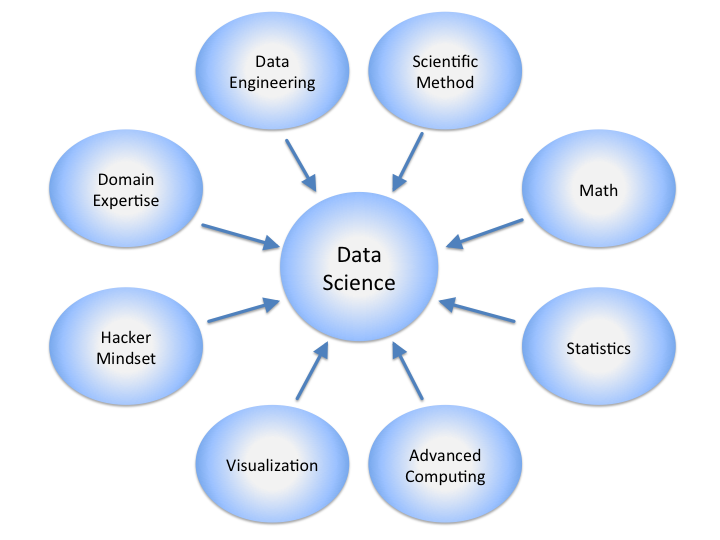
Below, a diagram extracted from Wikipedia, which situates data visualization among the data sciences:
Graphs
Concretely, there is a set of graphs that allow to channel data, to extract the most important information. The most crucial aspect of data visualization is to find the graph that is best suited to the type of data observed. Some graphs allow to represent static data, others dynamic data. Finally, some are intended for temporal data. Let's take a look at a few graphs.
The histogram, a classic for statisticians
Each column corresponds to a class, and allows to arrange the values of a variable. Simple, visual, efficient, indestructible.
Below, the number of penalties taken by soccer players:

The sankey diagram, ideal for flows
The Sankey diagram is a flow diagram where the width of the arrows is proportional to the flow itself. It was originally used to show the use and loss of energy in systems. The graph below shows for example the energy sources in the UK, and their uses:

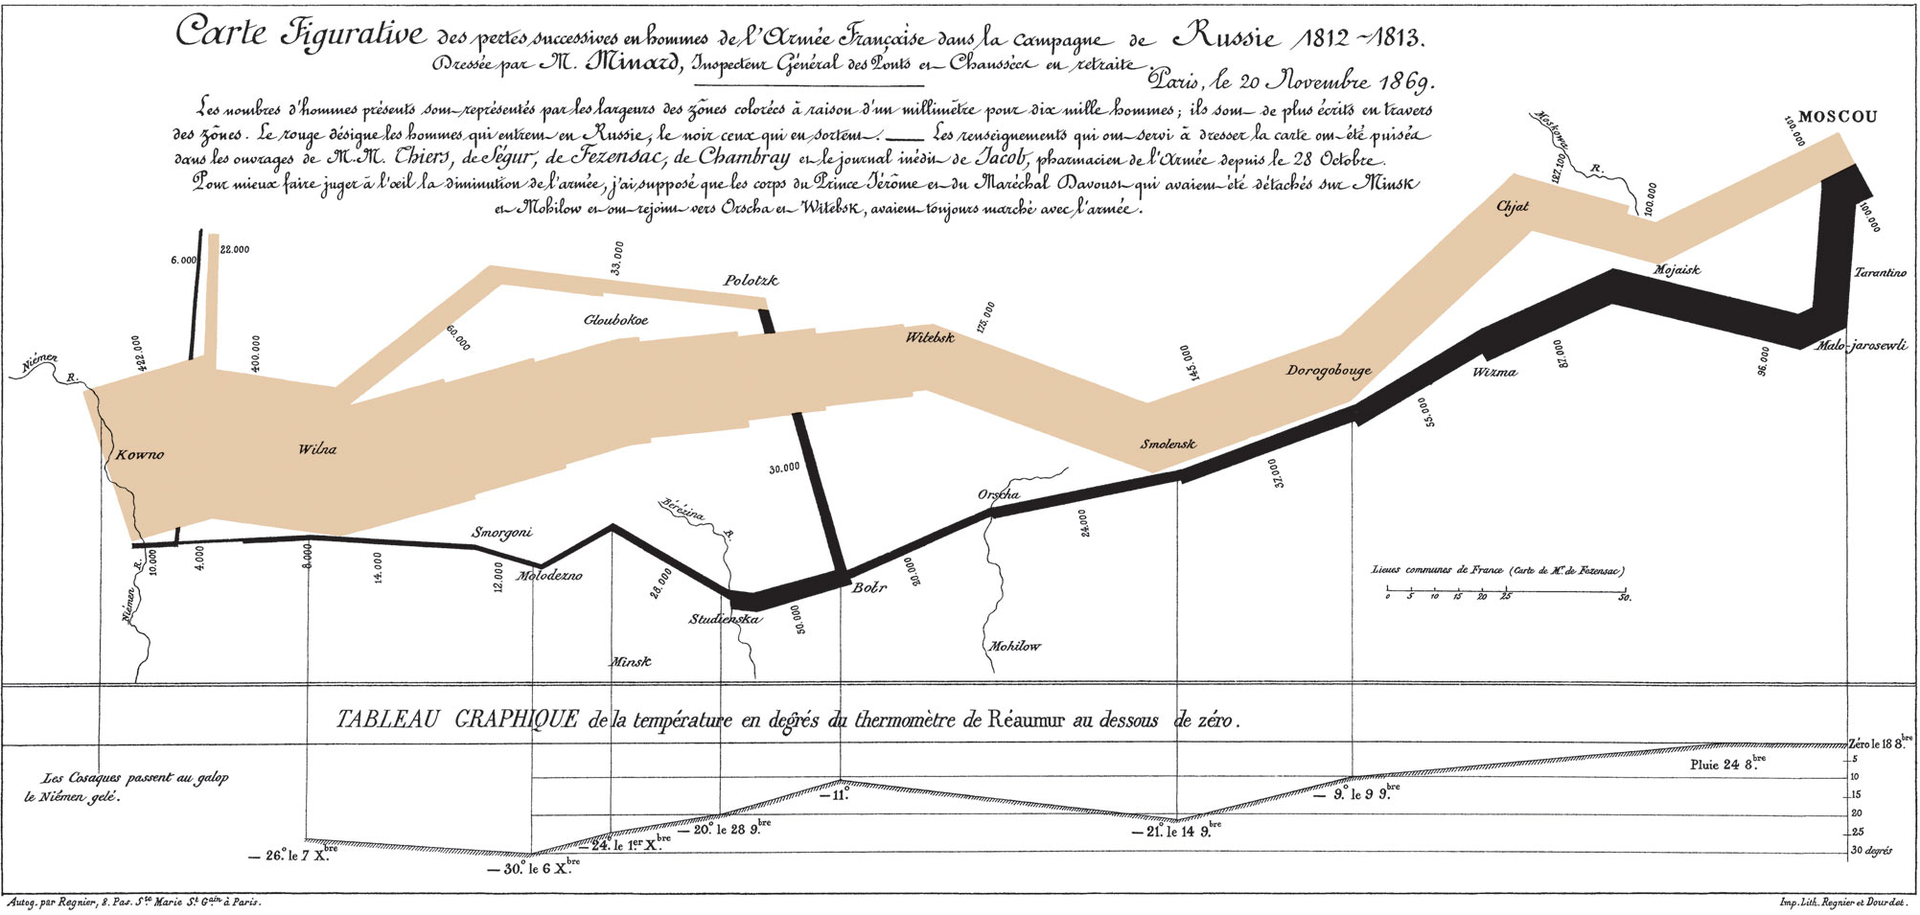
In a more original way, the Frenchman Charles Minard initially used this graph to represent the number of Napoleonic troops, during the Russian campaigns:
The arc diagram, to identify relationships between elements
The arc diagram is an original way to represent relationships between elements. Here is an example, which allows you to see the relationships between the Stark family and the Lannister family in the Game of Throne series:

Or also, with the arcs on both sides:

The proportional map or treemap
A diagram that presents square surfaces, in order to identify proportions. This diagram is very useful to have a representation of orders of magnitude. It is particularly used to represent the occupation of the memory on a computer.
Below is a representation of the proportions of the groups of musical instruments, according to the type of orchestra:

Hexagonal bining of data
The data are grouped in hexagons. The colors allow to quantify the importance of each hexagon. A drawing is better than long speeches, below, the shots of the basketball player Kobe Bryant represented according to the position in relation to the basket:

The Gant diagram
The essential diagram for all project managers, to represent the evolution of activities over time. As an example, here is the Gant chart of the Italian presidents and prime ministers over time:

Heatmap or heat map
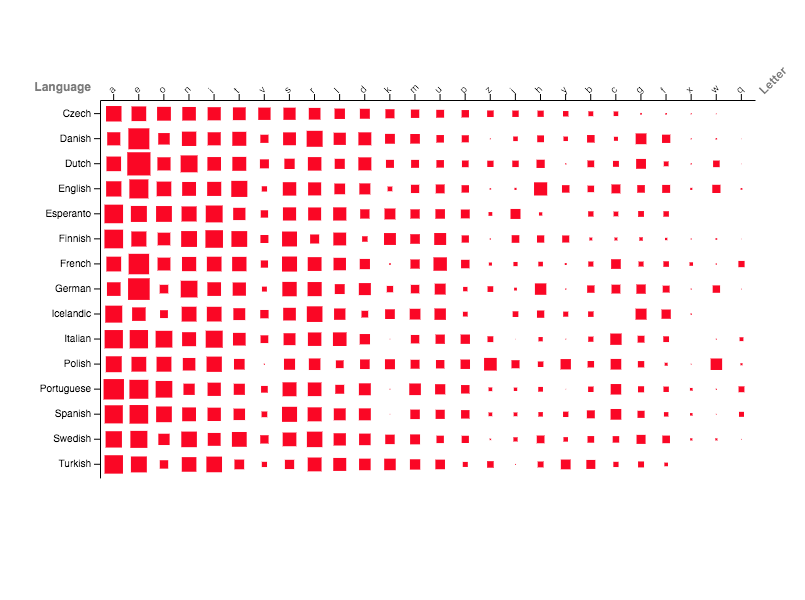
A representation by "heat zone" of the most frequented regions. This can be used to represent the frequency of use of letters according to language:
Sunburst Chart
A more advanced version of the pie chart that allows to represent hierarchies and proportions. Below, we can see the frequency of aromas in the wine:

Tools
There are many tools to build data visualization graphs like Excel, Power BI, Google Charts, D3js, Tableau, etc. And these tools are increasingly used to process the billions of data in our time. If you want to know more in the next articles about data visualization, subscribe to the newsletter!


